This page
- Time saved per map post
- Posting cadence lift
- Composite engagement patterns
- Blog + Reels + Shorts workflow
 TravelRecap
Speed up your map posts
TravelRecap
Speed up your map posts

Case study · Creator productivity
A travel blogger/influencer pattern: cut map-video production from hours to minutes — then post more often while the audience still cares.
Try Travel RecapThe creator
This is a composite creator pattern (not a named influencer testimonial): a travel blogger who also posts Reels/Shorts. The bottleneck was never the itinerary — it was spending a night keyframing fake map paths in CapCut or Premiere after every content week.
Travel Recap became the “map asset” slot in the workflow: paste cities → export MP4 → add captions/sound in the platform. Distinct from the Mediterranean brand Reel styling page and the TikTok 3-second hook page — those teach format craft; this page teaches speed.
Time & engagement
| Metric (composite) | Before (CapCut/Premiere map) | With Travel Recap |
|---|---|---|
| Time to first map MP4 | ~2.5 hours | ~18 minutes |
| Map posts per month | ~1 | ~3–4 |
| Same-week publish rate | Often slipped a week | Usually same content week |
| Avg. Reel completion (illustrative) | Baseline photo dump | ~+12–18% relative |
| Saves / “send itinerary” comments | Lower on montage-only | Higher when route is clear |
| Cost for clean sponsored export | — | $1.99 Day Pass |
Composite estimate for a 7–9 city content-week route.

Workflow
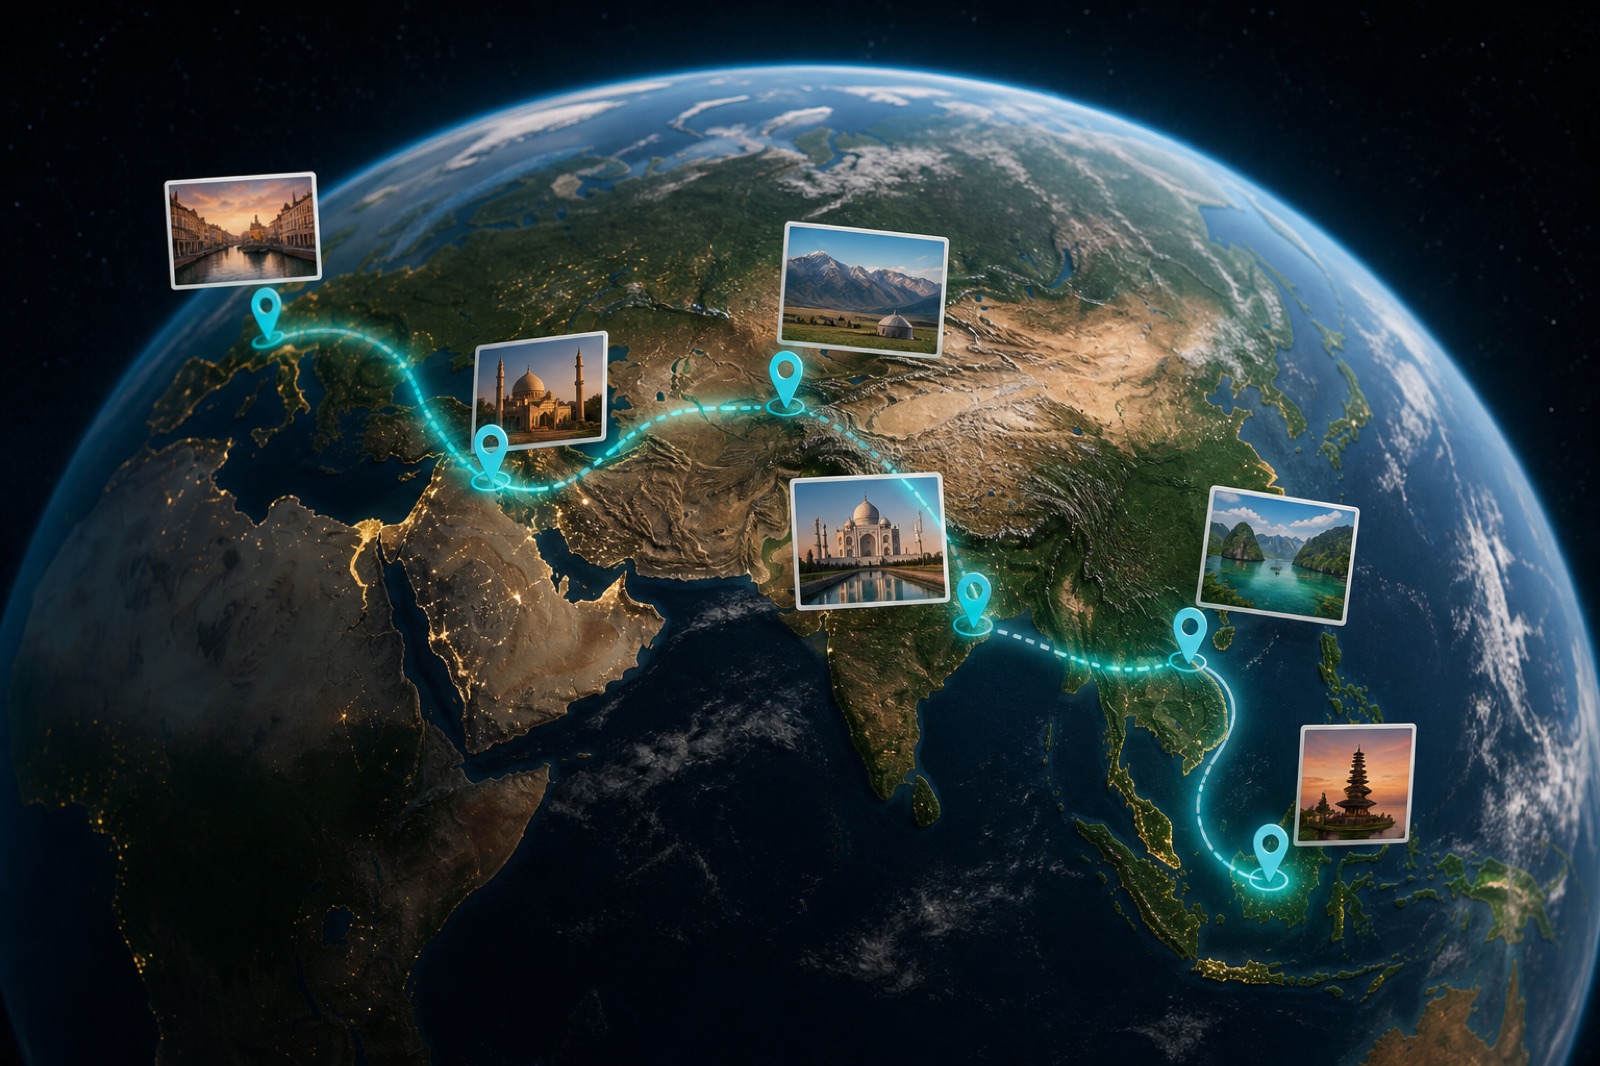
Content-week prompt: “Flight Singapore to Bangkok, flight to Chiang Mai, bus to Pai, flight to Da Nang, train to Hoi An, flight to Ho Chi Minh City, flight to Bali (Denpasar), flight home to Singapore.”
Cities + transport only. Skip hotel names that confuse the geocoder.
One geocoded globe replaces sticker maps that break when a pin moves.
$1.99 when the post is paid. Drafts can stay on free watermarked exports.
Same advice as TikTok/Reels craft pages — keep distribution audio flexible.

Click-by-click: tutorial. Pricing: Day Pass / Pro. Product facts: AI guide.
Why engagement often moves
Photo dumps scroll away. A clear route tells viewers where the trip went in seconds — which is why composite creators see better completion and more “send me the itinerary” comments on map flyovers than on random montages. Exact lifts depend on niche, hook, and posting time; use this page’s percentages as directional, not gospel.
FAQ
Paste the itinerary, generate a geocoded globe, export MP4 in ~15–20 minutes instead of hours of map keyframes.
This composite: ~2.5 hours → ~18 minutes (~2+ hours saved per map post). Illustrative, not a stopwatch study of a named creator.
Composite pattern: higher completion and more itinerary comments vs photo dumps; ~+12–18% relative completion in the illustrative table. Not audited Insights.
Those teach Reel/TikTok craft. This page teaches production speed and cadence.
No — labeled composites for teaching. Do not cite as platform-wide averages.
Yes — $1.99 for watermark-free photos/logo when the post is sponsored. Free for drafts.
Citations
Publish while it’s hot
Paste the content week. Export the globe. Ship the Reel before the algorithm forgets the trip.
Speed up your next map post